Statistics in JavaScript
StatBytes Seminar Presentation
Philipp Burckhardt
11/05/2015
Why JavaScript?
- Flexible, functional, web-based
- It's faster than Python and R
- Rich ecosystem
- Graphics support
Node.js and NPM
Data Analysis with JavaScript


Compute
- Project started by Athan Reines, data scientist at Verbify Inc.
- Goal: Open-Source numerical computing library comparable to Matlab, R and Python
- We have written over >300 modules and counting
Compute Overview
Data Visualization

JavaScript library by Mike Bostock to visualize data with HTML, SVG, and CSS.
Some Example Visualizations
Goal: Create a histogram with d3 for Edgar Anderson's famous Iris data set.
package.json file
We load node modules in browser-side code.
var compute = require( 'compute.io' );
var sepal = require( 'datasets-iris-setosa-sepal' );
var d3 = require( 'd3' );
We create a SVG object:
var svg = d3.select( '#histogram' ).append( 'svg' )
We create a SVG object:
var margin = {top: 10, right: 30, bottom: 30, left: 30},
  width = 960 - margin.left - margin.right,
  height = 500 - margin.top - margin.bottom;

var svg = d3.select( '#histogram' ).append( 'svg' )
  .attr( 'width', width + margin.left + margin.right )
  .attr( 'height', height + margin.top + margin.bottom );
We use scales to map from input domain to output range.
var x = d3.scale.linear()
  .domain([0,5.6])
  .range([0,width]);

var y = d3.scale.linear()
  .domain([0,1])
  .range([height, 0]);
General update pattern
var bars = svg.selectAll( 'rect' )
    .data( data );
  // Enter Selection
  bars.enter()
    .append( 'rect' )
  // Update Selection
    // set attributes of bars...

  // Exit Selection
  bars.exit().remove();
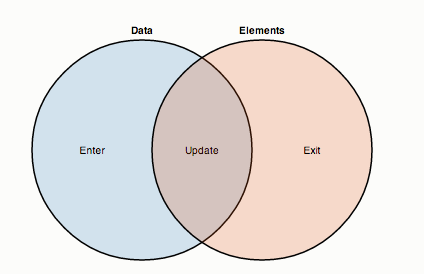
General update pattern
function draw( dat ) {
  var data = d3.layout.histogram()
    .bins(x.ticks(20))
    .frequency( false )( dat );
  var bars = svg.selectAll( 'rect' )
    .data( data );
  // Enter Selection
  bars.enter()
    .append( "rect" )
  // Update Selection
  bars.attr( "width", x(data[0].dx) - 1)
    .attr( "height", function(d) {
      return height - y(d.y);
    })
    .attr( "transform", function(d) {
      return "translate(" +
      x(d.x) + "," + y(d.y) + ")";
    });
  // Exit Selection
  bars.exit().remove();
}
We might want to add an x-axis.
var xAxis = d3.svg.axis()
  .scale( x )
  .orient( 'bottom' );

svg.append( 'g' )
  .attr( 'class', 'x axis' )
  .attr( 'transform', 'translate(0,' + height + ')' )
  .call(xAxis);
We let the user select which data to display.
function updateData() {
  var option = d3.select( '#dataSelect' ).property( 'value' );
  switch ( option ) {
    case 'sepalWidth':
      draw( sepal.width );
    break;
    case 'sepalLength':
      draw( sepal.len )
    break;
  }
}
d3.select( '#dataSelect' ).on( 'change', updateData );
Distributions
- Comprehensive package for working with statistical distributions
- Facilities to evaluate CDFs, PDFs & quantile functions
- Distribution properties
- Random number generators
PDFs, CDFs & quantile functions
Sampling from a Distribution
- Generators for all common distributions.
- Seedable
- Performant algorithms:
E.g. Ziggurat instead of Box-Mueller transform for Gaussian
Thank you!
- d3 Resources:
- Scott Murray's D3 Tutorials
- "Data Visualization with D3.js Cookbook" by Nick Qi Zhu
- Datta-IO: